Wednesday, April 13, 2016

Step-by-Step Procedure #2: Configuring RPi to Connect with UbiDots & the IoT

Setting up RPi to Connect
with UbiDots for a People and/or Animal Counter


This tutorial is based upon information from the Ubidots blog post:
Building a People Counter with Raspberry Pi and Ubidots - by Agustin Pelaez


Make sure you have all the latest libraries for Python and Ubidots to run on your RPi:


Type and hit enter for each of the following commands in your RPi terminal window:
$ sudo apt-get update
$ sudo apt-get upgrade
$ sudo apt-get install python-setuptools
$ sudo easy_install pip
$ pip install ubidots


The last 2 installs allow Node-Red on your RPi to talk to UbiDots.com to monitor your sensor’s data.


Set up a free Ubidots account. Log into your new account using a browser on your RPi. That will make it easy to copy/paste your Ubidot keycodes into Nano (also called LXTerminal) where you’ve copied/pasted the code from


Click on your username in the upper-righthand corner of your Ubidots dashboard and click on Credentials in the dropdown menu. That will reveal your account’s API Key and Token - codes that you will need to copy/paste into the Python code on your RPi.


To generate a variable (your virtual monitor), you click on “Sources” in the top menu, then click on “Add Data Source”. I named mine “SDVT People Counter 1”. Click on your newly named Data Source and that will open up the “Add Variable” panel.


The Final step is to click on the info icon in your new variable; that will reveal your variable key code that you will also copy/paste into your Python code. In named my variable “People Counter”.
Next you will copy/paste the following code into the Nano application and then hit Ctrl + X to exit GNU Nano... it will prompt you to save the new Python script with a file name. Give the name: peoplecounter.py


from ubidots import ApiClient
import RPi.GPIO as GPIO
import time


GPIO.setmode(GPIO.BCM) ## The T-Cobbler breakout cable uses GPIO.BCM - see chart below
GPIO.setup(sscrscrot, GPIO.IN)


try:
   api = ApiClient("a21ebaf64e14d195c0044fcc3b9f6dab9d653af3") ## replace this number with your Api number from your ubidots account
   people = api.get_variable("5238cec3f91b282c7357a140") ## replace this number with your variable number from ubidots account
except:
   print "Couldn't connect to the API, check your Internet connection"
counter = 0
peoplecount = 0
while(1):
   presence = GPIO.input(7) ## change this number to match the GPIO number for your PIR sensor input... I used (26) for input pin on my T-Cobbler. See chart below to
   if(presence):
       peoplecount += 1
       presence = 0
       time.sleep(1.5) ## change this number to shorten or increase the lapse time between live PIR data recordings - how long your PIR is turned off and not sensing motion
   time.sleep(1)
   counter += 1
   if(counter==10):
       print peoplecount
       people.save_value({'value':peoplecount})
       counter = 0
       peoplecount = 0
T-Cobbler BCM numbering for GPIO pins


After you’ve saved your peoplecounter.py file, go to the RPi menu and open Python Idle under “Programming”.
Next, to to the file menu in Idle, choose Open File under the file menu, then browse to the “peoplecounter.py” file you saved in Nano.


Once you see “restart” in your Python shell, you should start to see the live PIR data being printed out. If you stand in front of your PIR for more than one second your should see it register your presence. The longer you stand there, the higher the number.


ubidots greater than.PNG
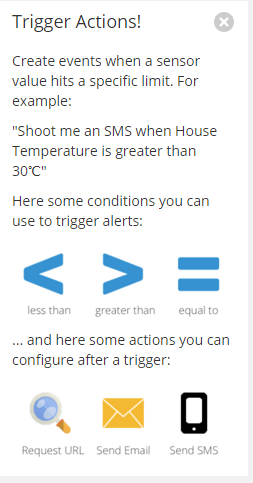
I also set up an “if this then that” Event in Ubidots “Events” page to send an email to me if the PIR records a figure greater than 6. You can also have SMS text to your phone.


You can also have a graph monitor your incoming data


For students doing the environmental science assignment: If you choose to use Ubidots or another IoT tool as your final project focus, please note that this tutorial is designed to provide a starting point for you to do your own remixed adaptation and research other IoT projects that collect scientific data.


Video Tutorials for Ubidots Setup


Raspberry Pi People and/or Animal Counter Part One - Ubidots IoT data Monitoring


Raspberry Pi People and/or Animal Counter Part Two - Email Alerts with Ubidots


Resource Links: ideas for scientific ways to use RPi, sensor, and IoT technology


Great forum posts about PIR and other sensors for collecting data on fish (cold blooded vs. warm blooded).


Step-by-Step Procedure #1: Starting a Node-Red Server on RPi

This tutorial is based upon information from the Ubidots blog post:


Equipment needed:
Raspberry Pi Model B+ or later with compatible micro USB power supply
Wireless keyboard with USB reciever
USB wi-fi adapter or Cat5 Ethernet cable
PIR sensor - please note that the PIR I used had 3 pins extending from the bottom of the sensor. The link for the Adafruit sensor has three-wire adapter that gives you more options for soldering longer wires and more flexibility for sensor placement (i.e. mounted on a ceiling).
HDMI Cable
LED monitor or TV with HDMI input
Internet Connection

Click on smaller thumbnail photos to enlarge.
Here is a picture of the PIR circuit that connects to the GPIO of the Raspberry Pi via the T-Cobbler breakout cable (the blue T shaped piece).


Close up of backside of the PIR sensor. The blue wire connects to the GND (ground) of the PIR and loops over to the negative rail on the side of the breadboard; this added grounding cable gives you the flexibility to have your PIR sensor at the far end of the breadboard for optimal clearance for sensing motion. The yellow wire connects to the 5.0V output from the T-Cobbler. The orange wire is the Out that connects to the #26 pin of the T-Cobbler that sends the sensor info to the GPIO on the RPi.

Once you have your circuit built, open up Node-Red under “Programming” in the RPi main menu.

Your Node-Red server console should open, showing the server IP address (URL) in the upper righthand corner of the console. Select and copy the URL.

Open up Midori or any other web browser and paste the Node-Red URL you copied into the address field of the browser. The Node-Red controller (graphic user interface) should load in your browser. This is where you will enter your “flow” to determine what your Node-Red server interacts with for the Internet of Things.

Now you are ready to start building your first Node-Red flow:
Video tutorial on Creating a Node-Red Flow to Collect Tweets (from around the globe).

For students doing the environmental science assignment: If you choose to use Node-Red as your final project focus, please note that this tutorial is designed to provide a starting point for you to do your own remixed adaptation and research other Node-Red projects that collect scientific data.

Friday, March 25, 2016

Raspberry Pi, Node Red, & the Internet of Things - Create With Code Final Project

I've decided to divide this project's material into a few separate blog posts. I wanted to create standalone blogs for my step-by-step tutorials: Procedure for Starting a Node-Red Server and Procedure for RPi Connecting to Ubidots since each post contains detailed screen-captures and instructions. One long post would have created a horribly long scrolling experience. I've also included a link to the Google Drive project folder which contains other components of this project such as resource links and the assessment rubric.

Intro Video for Project

Building a People/Animal Counter or a Node-Red Flow

Project Info:

Tools and Product

Node-Red is is an open-source, block-based or (aka “drag-and-drop”) programming tool developed by the IBM Emerging Technology Team for “wiring” devices and software to communicate with one another within the Internet of Things. Another open source tool introduced in this project is Ubidots, an web based API (Application Programming Interface) that specifies structure of data that will be exchanged between devices connected to the Cloud.

This all might sound a bit complex, but Node-Red doesn’t require the user to do any text-based coding, so it is a great tool for people to get started with learning about the IoT. Node-Red currently comes bundled with the most recent version of the Raspbian operating system, Jessie, for Raspberry Pi. Node-Red allows users to build "flows" which are graphical representations of devices communicating via the Cloud, collecting, transferring, analyzing, and sharing data.

For this project, students will be borrowing portions of code and concepts from a variety of provided online resources which are included in the Links for Online Resources doc. This unit of study will take approximately three weeks to complete and will culminate with students presenting their final projects to their classmates, teachers, parents, and possibly computer science mentors from the local community.

Goals and Purpose

This high school level project is designed as an intermediate to advanced unit that would be assigned to students who have already spent several weeks getting familiar with circuit building, sensors, and Raspberry Pi programming software used in conjunction the the Raspberry Pi GPIO (General Purpose Input Output). Students will be encouraged to have their final project focus on a real-life situation that relates to environmental science and/or the collection of data relating to human activity and the effects of that activity on the environment.

Summary

My primary goal for this project is to create an open-ended, flexible project that can be applied to many high school fields of study and hopefully inspire teachers to begin integrating computer science projects into their curriculum. With a few small adjustments, this project could be redesigned to align with math, art, or social studies state and tech standards. Raspberry Pi, Node-Red, and the Internet of Things all provide a massive menagerie of tools that can inspire creative thinking and exploration of new technologies which offer new learning opportunities to all genres of students.

Project Guidelines

Google Drive Project Folder - all docs

Sunday, March 20, 2016

Raspberry Pi Explorer Hat Pro Tutorial: Mod with 3 different Potentiometers for controlling Minecraft Virtual Bars: Part Two


This final remix of Pimoroni's Explorer Hat pro was definitely a challenge that forced me to do some major problem solving. Firstly, I found that the blue mini breadboard that comes with the Explorer Hat Pro didn't have power rails on either side, so I had to use a larger breadboard to make room for the 3 resistors (a SoftPot variable potentiometer and two rotary potentiometers). By using the larger breadboard, I was able to easily run a grounding jumper wire from the GND output of the Explorer Hat and positive jumper wire from the 5V output. Once I copied/pasted the code for the original potentiometer and created a new variable in the code called "blue", I created a 3rd variable called "green" for the SoftPot's voltage input.

It was also a challenge to set up the correct order of the 3 potentiometers on the breadboard to reflect the order of the 3 virtual colored bars. For example, I moved the SoftPot to the middle since it was controlling the middle green bar in Minecraft, and moved it's controlling jumper wire to the #1 analog input on the Explorer Hat Pro.

All in all, this final remix helped me get much more comfortable with editing the Python code within IDLE. I also liked the fact that the circuit was simple enough that I could devote more time to reworking the Python code instead of getting bogged down with building a complex circuit with multiple sensors, LEDS, resistors, etc.

For people trying to do a remix of this project, try using different sensors or potentiometers to alter the voltage readings being fed into the Explorer Hat Pro Analog inputs. Also, try altering the max height of the bars in the Python script to make the bars go higher or lower so they all don't have the same max height.


Controlling 3 virtual Minecraft bars (blue, green, red) with 3 potentiometers.


Fritzing Diagram of circuit and inputs to Explorer Hat Pro

Here is my final remix code:

import explorerhat
import explorercraft
import time

HEIGHT   = 50

red = explorercraft.BarGraph(1,0,0,50,50,explorercraft.WOOL_RED)

green = explorercraft.BarGraph(2,0,0,50,50,explorercraft.WOOL_GREEN)

blue = explorercraft.BarGraph(3,0,0,50,50,explorercraft.WOOL_BLUE)

while True:


    value2 = max(0,min(50,int(explorerhat.analog.one.read() * 10)))
    green.update(value2)
    
    value3 = max(0,min(50,int(explorerhat.analog.two.read() * 10)))
    blue.update(value3)

    value = max(0,min(50,int(explorerhat.analog.three.read() * 10)))
    red.update(value)
    
    print("red bar is {} green bar is {} blue bar is {}").format(value3,value2,value)

    time.sleep(0.1)

Thursday, March 17, 2016

Raspberry Pi Explorer Hat Pro Tutorial: Mod of Potentiometers controlling a Virtual Minecraft Bar: Part One

Feel free to use this blog post and it's follow up, Part Two, as a tutorial. I chose to not make this a step-by-step procedural tutorial. I intentionally left if open-ended to push learners new to coding (like myself) to be a bit more challenged by having to do some problem solving. I also included screenshots of my code in the hopes of prompting learners to write their own code in IDLE instead of copying/pasting the code. Typing out the code from scratch helped me understand the importance of the text formatting rules for Python.

Here's the list of parts you will need to do this tutorial:

Raspberry Pi Model B+ (slower, but slightly cheaper) = $30 or RPi2 or RPi 3 = $40
also the typical peripherals needed to start using your Raspberry Pi. These components vary in price, but Adafruit does sell a Raspberry Pi Starter Packs (monitor not included) for $60.
  • a wireless keyboard/mouse set
  • LED monitor with HDMI and HDMI cable
  • Micro USB Power Supply
  • micro SD card to install Raspberian (Jessie) onto
  • USB Wi-Fi for the RPi
Python installed on RPi free
  • here's a great tutorial video on the procedure for installing and getting started with Python (IDLE comes bundled with Raspbian Jesse OS) on RPi.
Pimoroni Explorer Hat Pro = $23
Rotary Potentiometer x 2 = $2.50
Jumper Wires Bundle = $2

Trying to modify the Explorer Hat Pro/Minecraft Virtual Thermometer Project turned out to be much more challenging than I imagined it would be. The first mod I wanted to attempt was to change the code to convert the analog voltage readings from the TMP36 sensor to Fahrenheit not Celsius when printing to the Python Shell with IDLE. I spent a few hours researching coding options and mainly just found a lot of info on Celsius to Fahrenheit conversion scripts. I tried and failed several times to take parts of conversion code that I found and use it to replace the following "while true" code:

while True:
temperature = 25 + (explorerhat.analog.one.read() - 0.75) * 100
print("The temperature is {}c".format(temperature))
thermometer.update(temperature)
time.sleep(0.1)

So I gave up after 10 remix attempts. I tried loading script variations into the Python shell and was greeted with a plethora of bright red errors that basically alerted me about my ineptitude with following proper Python protocols.

I then moved on to a totally different remix idea based on another script I found in the GitHub ExplorerCraft directory where a TMP36 sensor fed voltage into the #1 analog input of the Explorer Hat Pro and a variable resistor potentiometer sending voltage into the #2 analog input. 

Here is a screenshot of the code from GitHub:

I felt the script was short and simple; therefore, with my newbie coding abilities, I should be able to alter the code fairly quickly (a very naive thought). My goal was to eliminate the TMP36 sensor from the circuit, replace it with a 2nd potentiometer, and then replace the temperature related code with code for the 2nd potentiometer which would control a second virtual bar in Minecraft. I also renamed the print command code, replacing the variables of "thermometer" and "potentiometer" with "red" and "green" to represent the two virtual bars manipulated by the potentiometers.

My first semi-successful script caused both the green and the red bar to respond to just the analog #1 input from the smaller blue poteniometer because I copied and pasted the same "while true" lines for each variable.
1st attempt = just one potentiometer input worked.

It took me awhile to figure out that the first 3 digits in the variable code lines were the X,Y,Z Cartesian coordinates for the bars in Minecraft. The original script had the potentiometer-controlled bar's X coordinate at 1 (with the thermometer's X at 0); therefore the two bars stood flush against one another. I decided in my mod to set X at 2 for the second potentiometer variable (green), thus creating a bit of space between the two bars. Other changes I entered into my mod were, changing the first bar color to red and changing the temperature value to "value2". After four code rewrites I finally got everything to work.

2nd attempt = duplicate Cartesian coordinates created a "bar overlap".

3rd attempt = both potentiometers worked, but can't locate the bars in Minecraft

4th attempt = success with separating the bars and controlling each independently.

Here is a screenshot of my modified code:

I found this remix project to really help me understand the different components of a Python script. I really enjoyed solving the puzzle by identifying how each code line related to other lines. The error messages I got when trying to run the module also helped me rewrite faulty sections of code. Since there were no detailed step-by-step instructions included in the GitHub directory, I had to ramp-up my problem solving skills to a higher level, carefully examining cause and effect results. Being forced to not have step-by-step instructions, Fritzing circuit diagrams, or code that was ready to copy/paste into IDLE really pushed me to be slightly more independent. In Part Two, I will (and you will too if you are using this blog post as a tutorial) add a 3rd variable.

In part two of this project (see my next blog post), I will add a 3rd variable and matching sensor. If you are actually trying to follow along and do your own remix or my remix, I encourage you to try and insert the TMP sensor back into the circuit and add the temperature variable back into my modified script posted above.


Monday, March 14, 2016

Step Two for Minecraft Virtual Thermometer Project: Rising Temperature Causing Thermometer to Grow

The Pimoroni Explorercraft project I discovered has code that converts the voltage readings from the temperature sensor to Celsius, not Fahrenheit data. I spent about an hour searching for information on how to write python code that would do Farienheit conversion, but just couldn't find enough helpful info to figure out the new code I needed to write to replace the following original code for Celsius format:

while True:
temperature = 25 + (explorerhat.analog.one.read() - 0.75) * 100
print("The temperature is {}c".format(temperature))
thermometer.update(temperature)
time.sleep(0.1)
Hopefully, with  a bit of help from online forums, I'll figure out the Fahrenheit code rewrite.

I then ran into problems with having the RPi Model B+ crashing. I had the overclock settings in the Raspberry Pi configuration set to Turbo overclocking, and I think that was causing the RPi to crash when I tried to run Python IDEL and Minecraft simultaneously. I then set the overclocking to medium and the crashing stopped. It did take me a while to figure out that cursor control with Minecraft the Pi Edition was a bit glitchy... you can only gain control of the basic RPi cursor after you hit escape in Minecraft. Then to regain cursor control you have to get the cursor to hover over the Minecraft window and click.

Once I was able to run the python file, see the temperature sensor read-outs in the Python Shell, and finally see the virtual thermometer in the Minecraft scene, I realized that I couldn't get the temperature readings to go up beyond 30 degrees Celsius while griping the TMP36 sensor with my fingers. To see any visible changes in the virtual thermometer height I had to cool the TMP36 down with an ice-pack. Once I got the temp down to 20 C degrees I finally got some visible results.

Minecraft Pi Edition - Virtual thermometer controlled by TMP36


Minecraft Pi Edition - Analog bars controlled by rotary potentiometer


Friday, March 11, 2016

Step One for Minecraft Virtual Thermometer Project: Installing Explorer Hat Pro Software for RPi

I just got started with the first steps of setting up my Pimoroni Explorer Hat Pro... attaching it to the GPIO of a RPi, installing the software for the Hat, and then running the Python test file to make sure all the pins are functioning properly.

So my first step for testing out a Explorer Hat controlled Minecraft virtual thermometer is based on this tutorial I found on the Pimoroni site. I have to say I'm very intrigued by the idea of using a sensor circuit that integrates with the RPi and Python code to create a simulated thermometer in Minecraft (running locally on a RPi). I'm also a bit intimidated since I'm not exactly sure how it will all work. If all goes well with this experiment, I'd like to do a remix of this project by using a different sensor, possibly a photo cell resistor or PIR sensor in place of the temperature sensor.

Rewriting the code to interact with the new sensor could be a task that goes way beyond my capabilities, but I guess I will give it my best shot and hopefully find some coding guidance from programmers and/or forums. There is also an explorercraft library on Github that I can investigate.

Installing the Explorer Hat Pro Software on the RPi

I've got the Python code from Github copied and ready to paste into IDLE.

Tuesday, March 8, 2016

Modification of SIK Experiment #14 - Shift Register IC

To get more confident with modifying Arduino code, I chose to rework the Shift Register IC Experiment #14 that came with the Sparkfun Inventor's Kit. I omitted the binary counting function, and then altered the delay timing and blink patterns of the other functions (oneAfterAnother, pingPong, randomLED, and marquee). I also created an additional random function called randomLED1.

RandomLED1 function had a delay time of 40 milliseconds and three different random indexes. In contrast, the RandomLED function had a delay time of 100 milliseconds and one random index of  3.

SIK Experiment #14 Mod

Here's is my code modification:

int datapin = 2; 
int clockpin = 3;
int latchpin = 4;

byte data = 0;

void setup()
{
  pinMode(datapin, OUTPUT);
  pinMode(clockpin, OUTPUT);  
  pinMode(latchpin, OUTPUT);
}

void loop()
{

  oneAfterAnother();      // All on, all off with altered sequence of HIGH LOW
  
  randomLED1();          // Blink random LEDs with delay of 40 milliseconds 

  oneOnAtATime();       // Scroll down the line

  pingPong();           // Like above, but back and forth with altered sequence of HIGH LOW

  randomLED();          // Blink random LEDs with delay of 100 milliseconds 

  marquee();

}

void shiftWrite(int desiredPin, boolean desiredState)

{

  bitWrite(data,desiredPin,desiredState);
  shiftOut(datapin, clockpin, MSBFIRST, data);
  digitalWrite(latchpin, HIGH);
  digitalWrite(latchpin, LOW);
}


void randomLED1()
{
  int index;
  int delayTime = 40; // time (milliseconds) to pause between LEDs
                      
  index = random(1);    // pick a random number between 0 and 7
  index = random(2);
  index = random(3);
  shiftWrite(index, HIGH);  // turn LED on
  delay(delayTime);     // pause to slow down the sequence
  shiftWrite(index, LOW);   // turn LED off
}


void oneAfterAnother()
{
  int index;
  int delayTime = 100; // Time (milliseconds) to pause between LEDs

  for(index = 0; index <= 7; index++)
  {
    shiftWrite(index, HIGH);
    delay(delayTime);                
  }

  for(index = 7; index >= 0; index--)
  {
    shiftWrite(index, LOW);
    delay(delayTime);
  }
}


void oneOnAtATime()
{
  int index;
  int delayTime = 50; // Time (milliseconds) to pause between LEDs

  for(index = 0; index <= 7; index++)
  {
    shiftWrite(index, HIGH);    // turn LED on
    delay(delayTime);       // pause to slow down the sequence
    shiftWrite(index, LOW); // turn LED off
  }
}


void pingPong()
{
  int index;
  int delayTime = 70; // time (milliseconds) to pause between LEDs

  // step through the LEDs, from 0 to 7

  for(index = 0; index <= 7; index++)
  {
    shiftWrite(index, HIGH);    // turn LED on
    delay(delayTime);       // pause to slow down the sequence
    shiftWrite(index, LOW); // turn LED off
  }

  // step through the LEDs, from 7 to 0

  for(index = 7; index >= 0; index--)
  {
    shiftWrite(index, HIGH);    // turn LED on
    delay(delayTime);       // pause to slow down the sequence
    shiftWrite(index, LOW); // turn LED off
  }
}


void randomLED()
{
  int index;
  int delayTime = 100; // time (milliseconds) to pause between LEDs

  index = random(3);    // pick a random number between 0 and 7

  shiftWrite(index, HIGH);  // turn LED on
  delay(delayTime);     // pause to slow down the sequence
  shiftWrite(index, LOW);   // turn LED off
}


void marquee()
{
  int index;
  int delayTime = 100; // Time (milliseconds) to pause between LEDs

  // Step through the first four LEDs
  // (We'll light up one in the lower 4 and one in the upper 4)

  for(index = 0; index <= 4; index++)
  {
    shiftWrite(index, HIGH);    // Turn a LED on
    shiftWrite(index+5, HIGH);  // Skip four, and turn that LED on
    delay(delayTime);       // Pause to slow down the sequence
    shiftWrite(index, LOW); // Turn both LEDs off
    shiftWrite(index+1, LOW);
  }

                
  shiftOut(datapin, clockpin, MSBFIRST, data);

  digitalWrite(latchpin, HIGH);
  digitalWrite(latchpin, LOW);

  data++;

  delay(delayTime);
}